 Business accounts & payment platforms
Understand the customer.
Across every product.
Cooper brings account, FX and payment activity into one view
of the relationship, so meaningful changes are easier to see.

APPLICATION CONCEPT · SYNTHETIC DATA
Dashboard preview · Explore the interactive view on desktop.
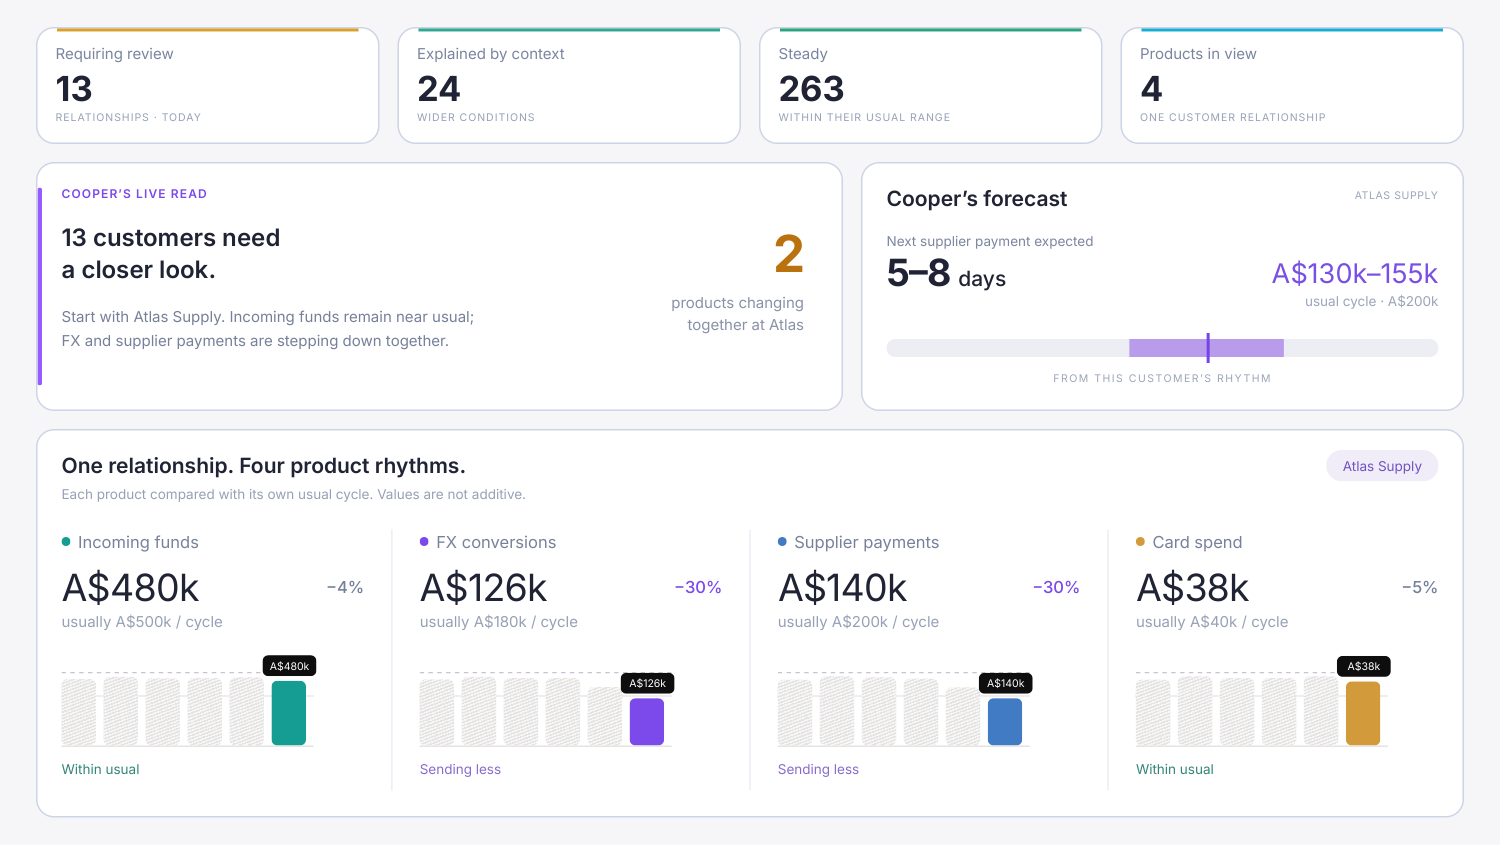
Requiring review
13RELATIONSHIPS · TODAYExplained by context
24WIDER CONDITIONSSteady
263WITHIN THEIR USUAL RANGEProducts in view
4ONE CUSTOMER RELATIONSHIPCOOPER’S LIVE READ
NEW READ
13 customers need
a closer look.
Start with Atlas Supply. Incoming funds remain near usual;
FX and supplier payments are stepping down together.
together at Atlas
Cooper’s forecast
ATLAS SUPPLYNext supplier payment expected
5–8 daysFROM THIS CUSTOMER’S RHYTHM
One relationship. Four product rhythms.
Atlas SupplyEach product compared with its own usual cycle. Values are not additive.
Incoming funds
usually A$500k / cycle
Within usual
FX conversions
usually A$180k / cycle
Sending less
Supplier payments
usually A$200k / cycle
Sending less
Card spend
usually A$40k / cycle
Within usual
The whole relationship
Same customer.
Different rhythms.
Account activity, FX conversions, card spend and supplier payments each tell part of the story.
Cooper connects those signals while comparing each product with the customer’s own usual behaviour. A change across products can reveal more than any one total.
ONE RELATIONSHIP · DISTINCT PRODUCT RHYTHMS
Each product against its own usual.
Incoming funds
A$480k / usual A$500k
FX conversions
A$126k / usual A$180k
Supplier payments
A$140k / usual A$200k
Card spend
A$38k / usual A$40k
ATLAS SUPPLY · ILLUSTRATIVE FORECAST
 Supplier payments
Expected next payment
A$130–155k A$200kA$200kA$195kA$205kA$202kA$198kA$172kA$140k
 Expected activity
Know what to
watch next.
A quieter period means more when you know when a customer would normally act.
Cooper learns expected timing and value, giving the relationship team a window to review and a next observation that can strengthen or change the read.
 Ask Cooper
A reason to look.
A place to ask.
Ask what changed, whether the wider market explains it and what to discuss with the customer.
Cooper keeps the observed activity separate from possible explanations. The relationship team decides what to do next.
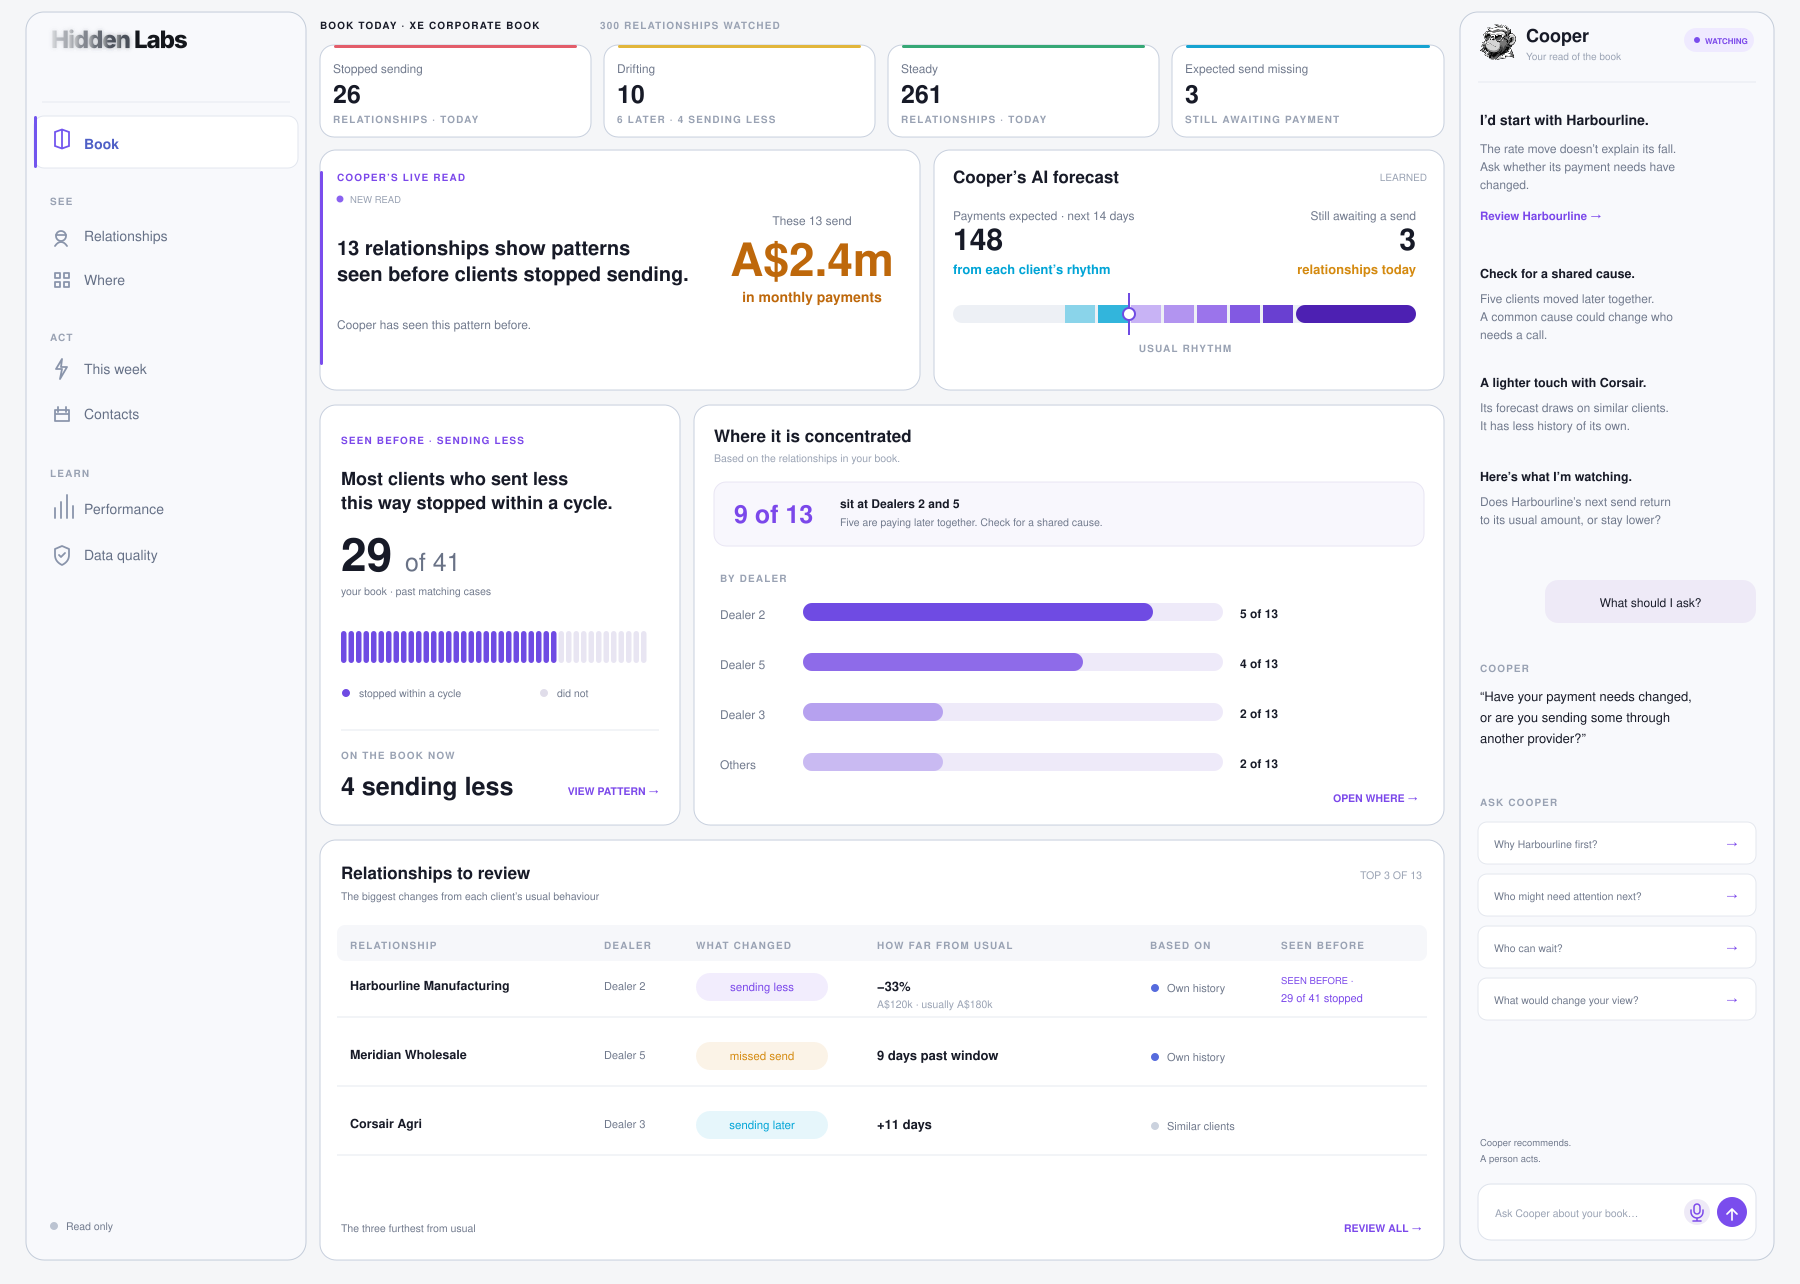
Cooper
Your read of the relationship
I’d take a closer look at Atlas Supply.
The change is across FX and supplier payments.
Incoming funds remain near their usual level.
Scripted concept · Cooper recommends. Your team acts.

Start with the history you already have.
A private data study can explore how Cooper reads behaviour
across your customer relationships and products.