 Trading platforms & brokers
Know every trader.
See risk across your platform.
Cooper’s AI learns each trader’s behaviour, recognises developing patterns
and gives your team an earlier view of who needs attention and why.

DESK MANAGER VIEW · LIVE WALKTHROUGH · SAMPLE DATADESK MANAGER VIEW · SAMPLE DATA
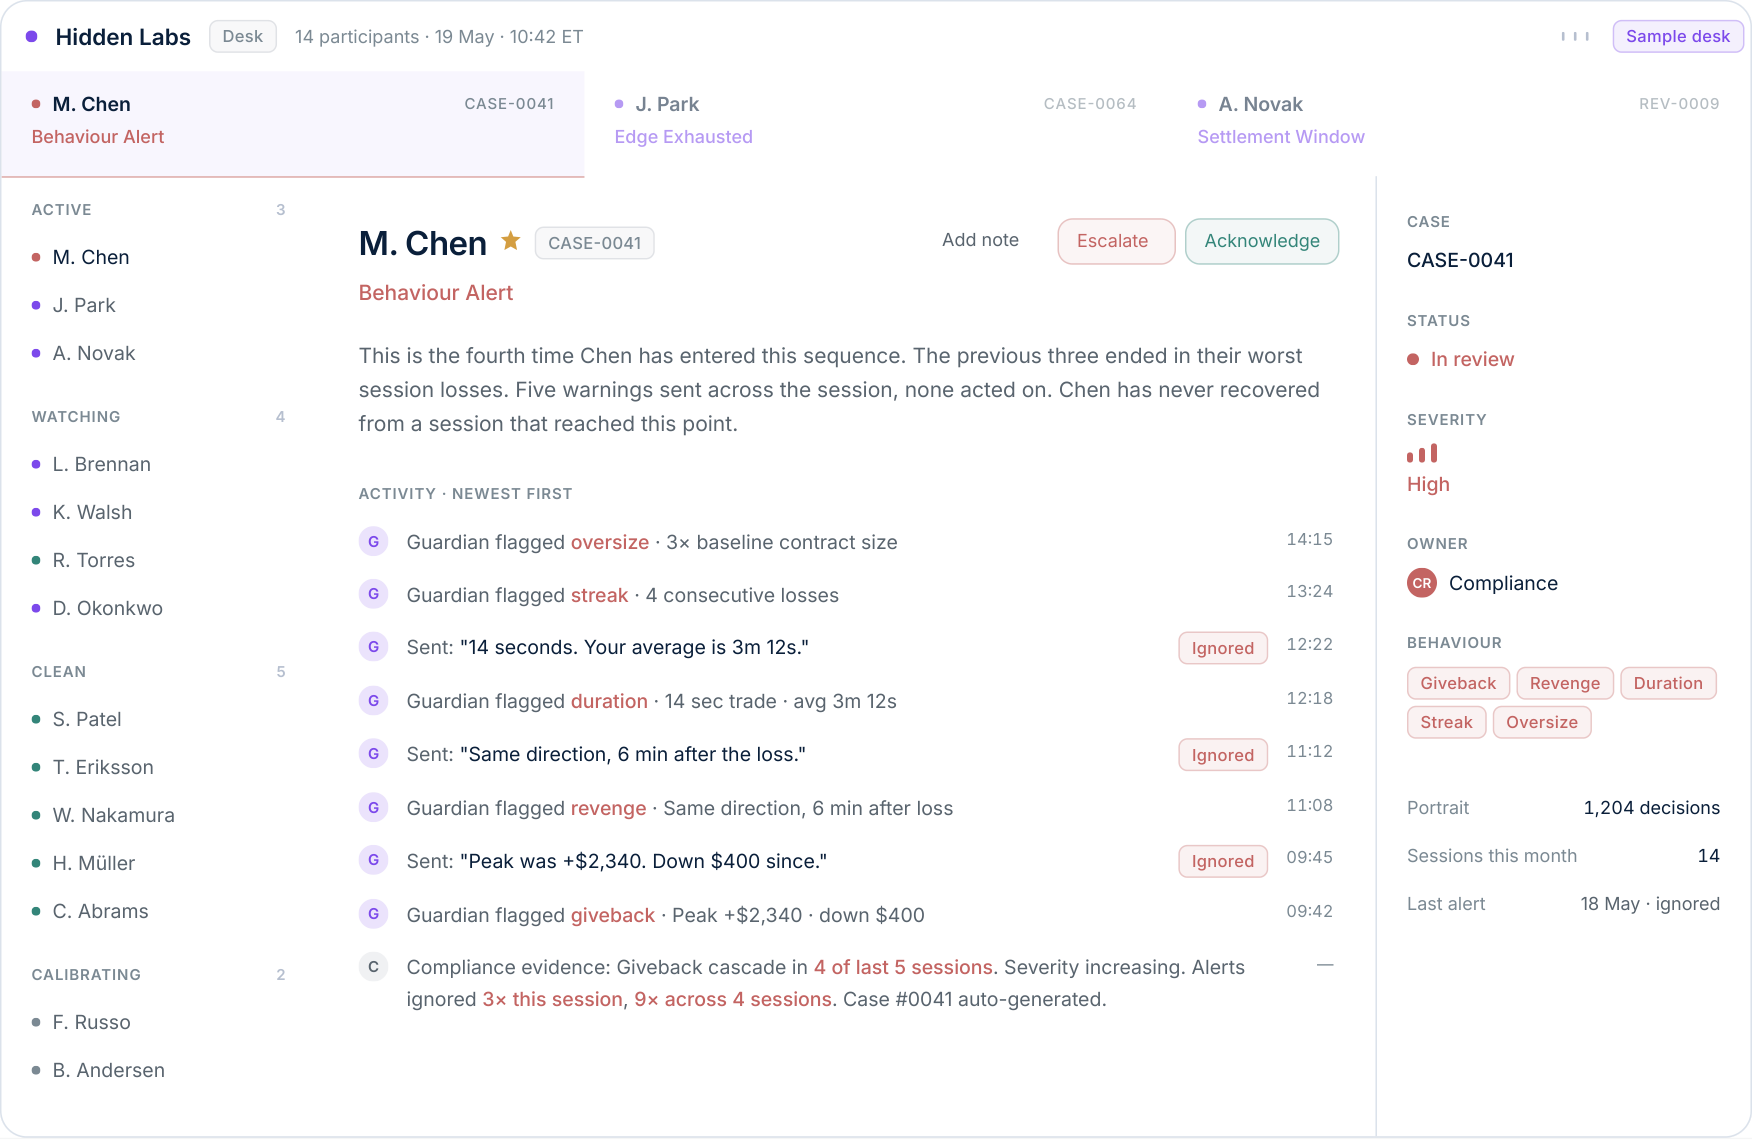
Dashboard preview · Explore the interactive view on desktop.
Individual journey
A living portrait.
Built over every session.
Cooper builds a continuously updated model of behaviour under pressure from that trader’s own history.
Each session sharpens the signal. Repeating sequences become clearer over time.
INDIVIDUAL HISTORY
One trader.
Their own
baseline.
Behaviour understood
across their sessions.

Frequency
The pace and duration
of their usual activity.

Position sizing
How their exposure changes
as the session develops.

Response after loss
What they tend to do next,
and how that changes.
SESSION WALKTHROUGH · SAMPLE DATA
The pattern problem
Recognise the
sequence earlier.
Changes in timing, activity and size can form a developing sequence. Each observation gains meaning from what came before.
Cooper connects that sequence with earlier outcomes, then keeps the team’s response and the eventual result in the record.
From observation to review
A developing pattern. A clear case for review.
Detect
A change against that trader’s own history.

Connect
Related observations build the evidence.
Review
Your team sees what needs attention and why.
Record
The response stays linked to the case.
 Ask Cooper
A clear read.
Evidence behind it.
Ask why a trader was flagged, how their own history supports the read and what deserves a closer look.
Cooper explains the developing pattern in the context of the individual and the market. Your team decides how to respond.
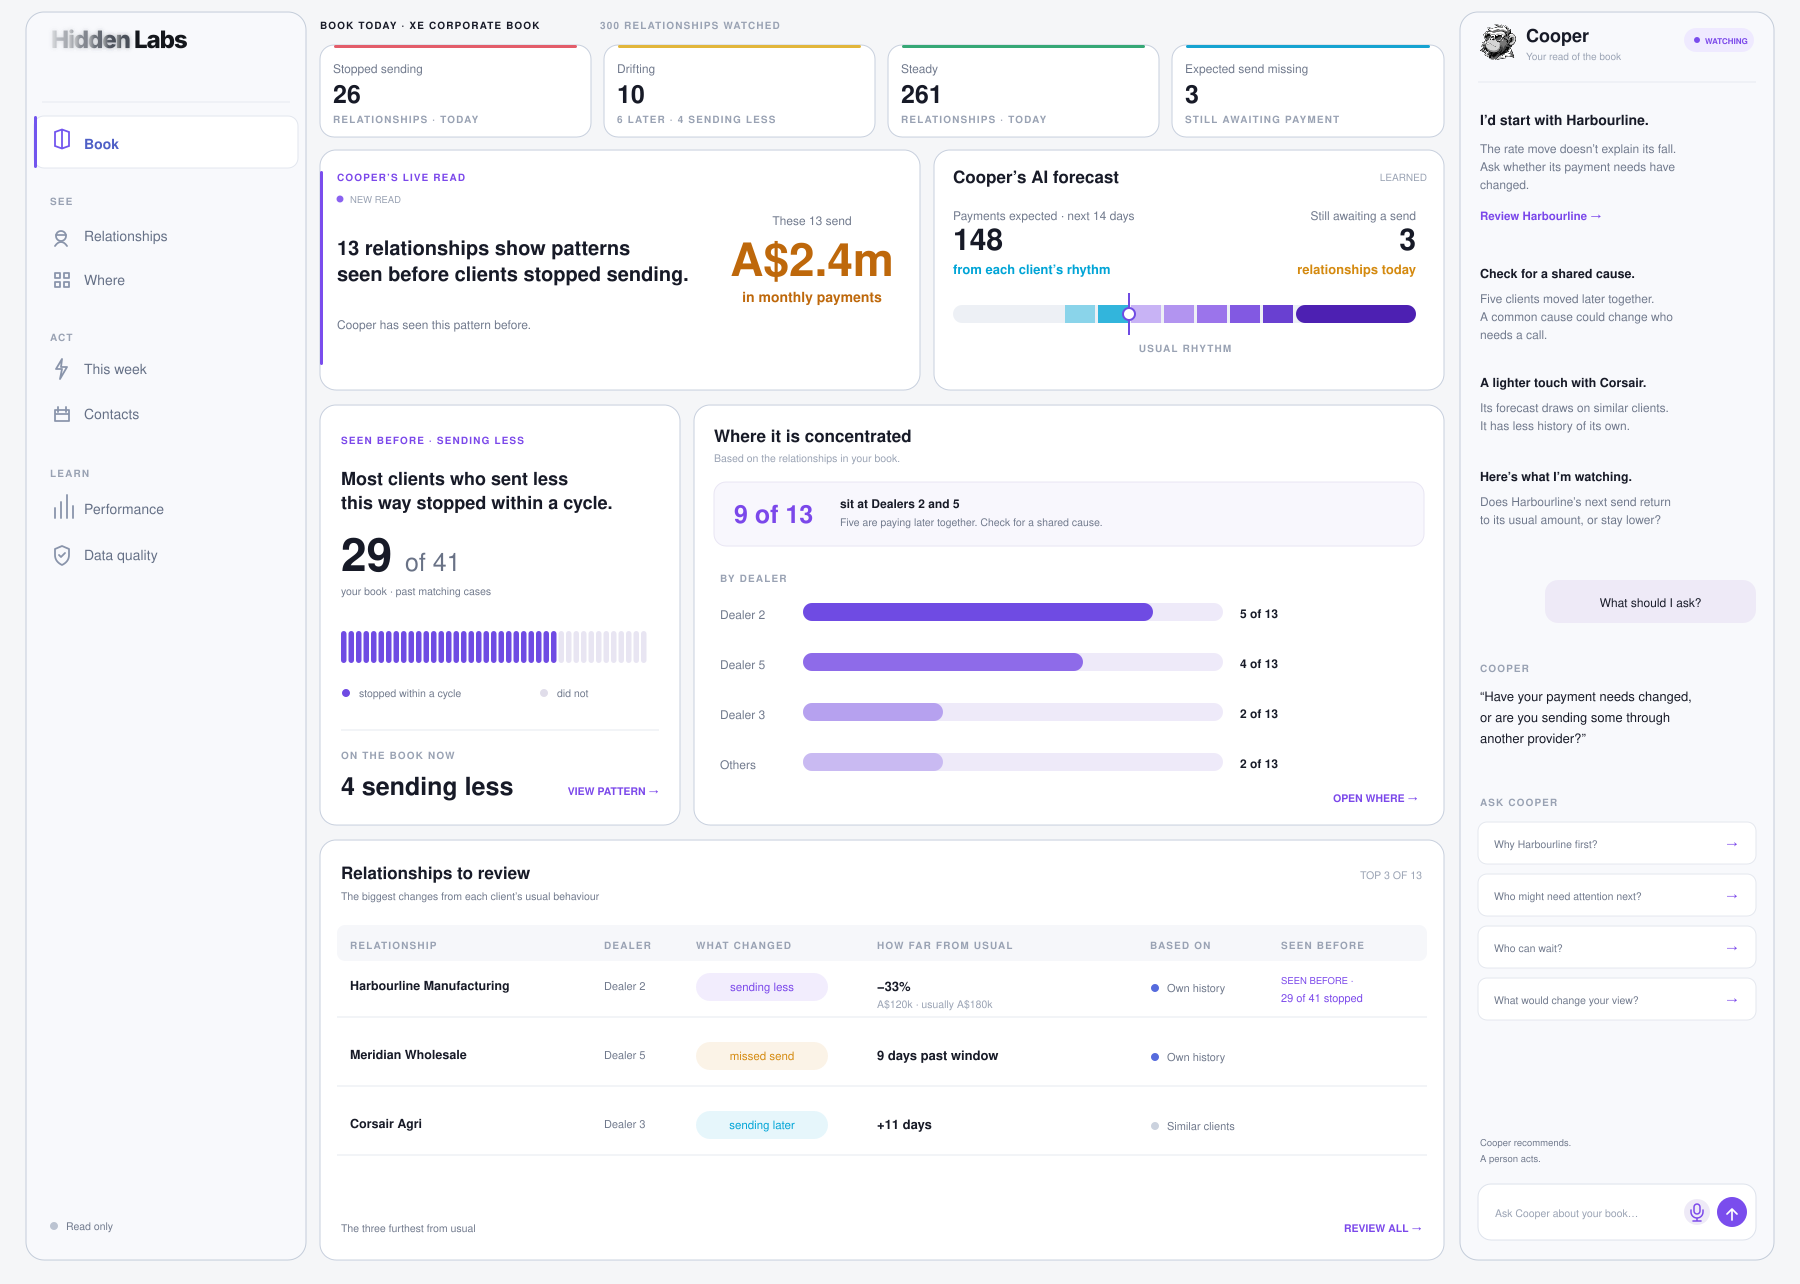
Cooper
Your read of the desk
I’d review Chen’s session first.
Five changes are forming a familiar sequence.
The pattern has appeared in three earlier sessions.
Scripted concept · Cooper recommends. Your team acts.
Alongside your systems
Fits alongside your existing platform.
Cooper reads executions, positions and session context to surface behavioural patterns for your desk.
Bring the evidence into your team’s existing workflow. Your team decides how to respond.
YOUR EXISTING DATA · CONNECTED TO YOUR TEAM
Executions
Entries, exits and timing.
Positions
Size and exposure.
Session context
The market around them.
Cooper
Individual patterns.
Developing risk.
OBSERVATIONS & EVIDENCE
Your team
Review, respond and
record the outcome.
Decisions and actions stay with your team.
Measured outcomes
Predict. Measure. Prove.
Connect the earlier warning, your team’s response and what happened next.
-
01Predict
Recognise the risk earlier.
Learn each trader’s recurring patterns and forecast where a developing sequence may lead.
-
02Measure
Record what your team did.
Link each warning to the review, response and timing. Keep the evidence in one record.
-
03Prove
Compare with what followed.
Compare predicted and observed outcomes. Track whether behaviour changes over later sessions.
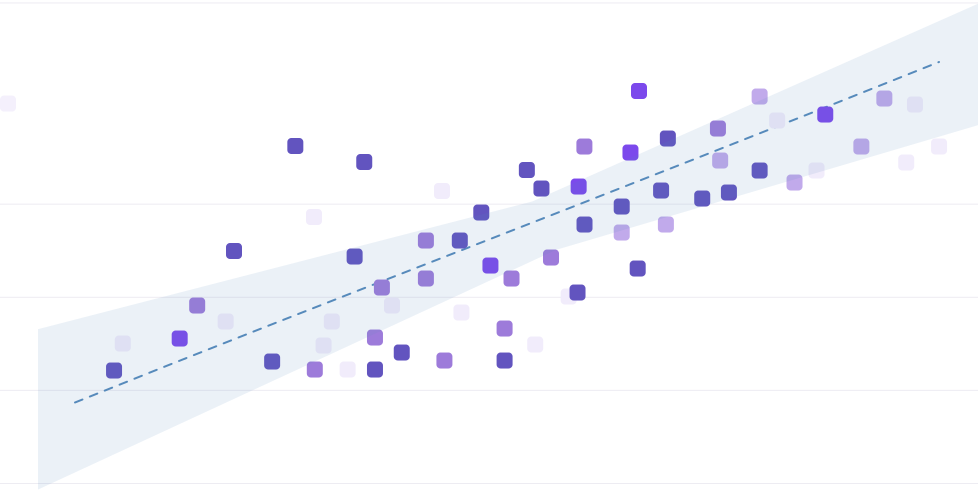
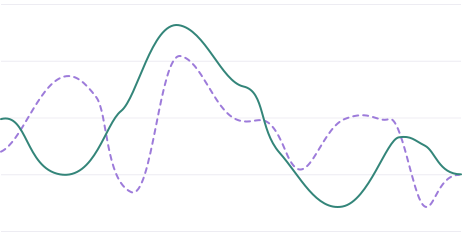
Illustrative workflow · Each trader measured against their own history.

See what your trading history reveals.
Explore individual behaviour, developing patterns and
the evidence behind Cooper’s read of your trading population.